Data scientist is a professional who uses programming, statistics, and machine learning techniques to analyze large datasets and extract valuable insights. They work with raw and structured data to help companies make better business decisions through data-driven insights.
Preparing with data scientist interview questions and answers is very important, as it allows candidates to showcase their technical skills, analytical thinking, and problem-solving abilities during interviews.
In this guide, we have shared a collection of popular interview questions covering topics suitable for both freshers and experienced professionals, including scenario-based and topic-specific questions often asked in real-world interviews.
You can also download these questions and answers as a PDF to prepare offline, helping you get ready to tackle various data science concepts, from data preprocessing and modeling to visualization and reporting.
Table of Contents
Data Scientist Interview Questions and Answers for Freshers PDF
Let’s start with the fundamentals. If you are a fresher preparing for an entry-level data Scientist role, here are some popular and common data Scientist interview questions you may face during your interviews.
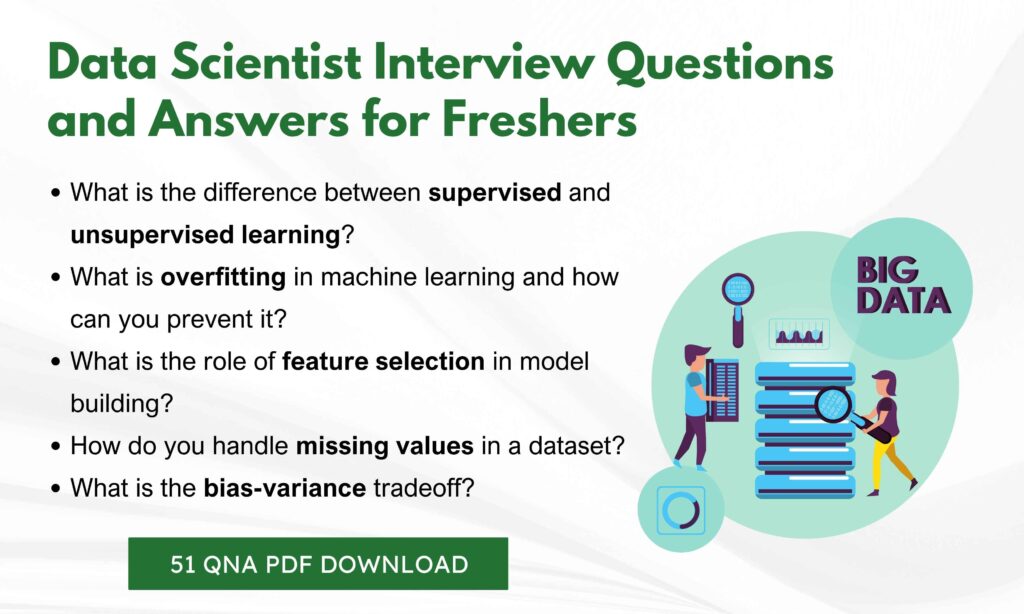
1. What is the difference between supervised and unsupervised learning?
Answer:
Supervised learning uses labeled data to train models, where the outcome is known (e.g., classification, regression). Unsupervised learning deals with unlabeled data and identifies patterns or structures (e.g., clustering, dimensionality reduction).
2. What is overfitting in machine learning and how can you prevent it?
Answer:
Overfitting occurs when a model learns the training data too well, including noise, and fails to generalize to unseen data. To prevent it, use techniques like cross-validation, regularization (L1/L2), dropout (in neural networks), pruning, or reduce model complexity.
3. What is the bias-variance tradeoff?
Answer:
It refers to the balance between bias (error from assumptions in the model) and variance (error from sensitivity to small fluctuations in training data). High bias can cause underfitting, and high variance can cause overfitting. A good model finds the optimal tradeoff.
4. How is a decision tree different from a random forest?
Answer:
A decision tree is a single tree that splits data based on features to predict output. A random forest is an ensemble of multiple decision trees combined to improve prediction accuracy and control overfitting.
5. What is the role of feature selection in model building?
Answer:
Feature selection identifies the most relevant variables for a model, improving accuracy, reducing overfitting, and speeding up training by eliminating irrelevant or redundant data.
6. What are some common feature selection techniques?
Answer:
Techniques include filter methods (e.g., correlation, chi-square), wrapper methods (e.g., recursive feature elimination), and embedded methods (e.g., LASSO, decision tree feature importance).
7. What is the difference between classification and regression?
Answer:
Classification predicts discrete labels or categories (e.g., spam or not), while regression predicts continuous values (e.g., house prices, temperature).
8. Explain the concept of cross-validation.
Answer:
Cross-validation is a technique to evaluate model performance by splitting the dataset into multiple parts (folds). One fold is used for validation, and the others for training, and the process repeats to ensure robustness. Common method: k-fold cross-validation.
9. What is dimensionality reduction, and why is it important?
Answer:
Dimensionality reduction reduces the number of features while preserving data integrity, improving model performance, visualization, and reducing overfitting. Techniques include PCA (Principal Component Analysis) and t-SNE.
10. How do you handle missing values in a dataset?
Answer:
Common techniques include removing rows/columns with missing values, imputing with mean/median/mode, using algorithms that support missing data, or creating indicators for missingness.
11. What is normalization and standardization?
Answer:
Normalization rescales data between 0 and 1. Standardization transforms data to have a mean of 0 and standard deviation of 1. Both help models perform better by ensuring features are on a similar scale.
12. What is logistic regression and when do you use it?
Answer:
Logistic regression is used for binary classification problems. It models the probability of a class using the sigmoid function and is suitable when the output variable is categorical.
13. What are confusion matrix, precision, recall, and F1-score?
Answer:
A confusion matrix shows TP, TN, FP, FN.
- Precision = TP / (TP + FP)
- Recall = TP / (TP + FN)
- F1-score = 2 * (Precision * Recall) / (Precision + Recall)
These metrics evaluate classification model performance.
14. What is the purpose of regularization in machine learning?
Answer:
Regularization penalizes complex models to prevent overfitting by adding a term to the loss function. L1 (Lasso) removes irrelevant features, and L2 (Ridge) shrinks coefficients.
15. What are some assumptions of linear regression?
Answer:
Assumptions include linearity, independence of errors, homoscedasticity (constant variance of errors), normal distribution of errors, and no multicollinearity among features.
16. How is KNN (K-Nearest Neighbors) algorithm used in classification?
Answer:
KNN classifies a data point based on the majority label of its k nearest neighbors in the feature space. It’s a lazy learner, non-parametric, and works well for small datasets.
17. What is the curse of dimensionality?
Answer:
It refers to the problems that arise when data has too many features, such as increased computational cost and sparsity, making it harder for models to learn effectively. Dimensionality reduction helps mitigate this issue.
18. What is the difference between bagging and boosting?
Answer:
Bagging builds multiple models in parallel using bootstrapped samples to reduce variance (e.g., Random Forest). Boosting builds models sequentially, where each model learns from the errors of the previous one to reduce bias (e.g., XGBoost, AdaBoost).
19. What is A/B testing and how is it used in data science?
Answer:
A/B testing is a statistical method to compare two versions (A and B) to determine which performs better. It’s widely used in product optimization, UX testing, and marketing campaigns.
20. How do you choose the right evaluation metric for a model?
Answer:
It depends on the problem type and business goal. For balanced classification: accuracy. For imbalanced data: precision, recall, F1-score. For regression: RMSE, MAE, R². Metrics must align with what matters most for the use case.
Detailed Interview Guide here: Data Scientist Interview Questions for Freshers

Also check: IT Interview Questions and Answers PDF 2025
Data Scientist Interview Questions and Answers for Experienced
21. What are the key differences between L1 and L2 regularization?
Answer:
| Feature | L1 Regularization (Lasso) | L2 Regularization (Ridge) |
|---|---|---|
| Penalty Term | Absolute value of weights | Square of weights |
| Feature Effect | Can eliminate features | Shrinks coefficients |
| Output | Sparse model | All features retained |
22. What is multicollinearity and how do you detect and fix it?
Answer:
Multicollinearity occurs when two or more independent variables are highly correlated. This causes instability in coefficient estimates.
Detection:
- Correlation matrix
- Variance Inflation Factor (VIF)
Fixes:
- Drop correlated features
- Use PCA
- Apply regularization
23. Explain types of gradient descent and their differences.
Answer:
- Batch Gradient Descent: Uses the entire dataset
- Stochastic Gradient Descent (SGD): Uses one sample at a time
- Mini-Batch Gradient Descent: Uses a small subset (batch) of data
| Type | Speed | Stability | Usage |
|---|---|---|---|
| Batch | Slow | Very Stable | Good for small datasets |
| SGD | Fast | Noisy | Real-time updates |
| Mini-Batch | Balanced | Stable | Best overall |
24. How do you handle imbalanced datasets?
Answer:
- Use resampling:
- Oversample minority class
- Undersample majority class
- SMOTE (Synthetic Minority Over-sampling Technique)
- Change evaluation metrics: use F1-score, precision-recall
- Use class weights in model algorithms
- Try ensemble methods like XGBoost or Balanced Random Forest
25. What is AUC-ROC and what does it signify?
Answer:
- ROC Curve: Plots true positive rate vs false positive rate
- AUC: Area under the ROC curve, ranges from 0 to 1
- AUC = 0.5 means random predictions
- AUC close to 1 means excellent model performance
26. When is Naive Bayes preferred over complex models?
Answer:
- When working with text or document classification
- High-dimensional data
- Real-time predictions required
- Simple baseline model
- Fast and effective when independence assumption holds
27. What is the difference between bagging and stacking?
Answer:
- Bagging: Combines multiple models trained independently (e.g., Random Forest)
- Stacking: Combines models using a meta-learner that learns from their outputs
| Feature | Bagging | Stacking |
|---|---|---|
| Training | Parallel | Sequential |
| Goal | Reduce variance | Improve accuracy |
| Example | Random Forest | Ensemble with meta-model |
28. How does XGBoost handle missing values?
Answer:
XGBoost assigns a default direction for missing values during tree splitting. It learns this from the data, so it doesn’t require imputation. This makes XGBoost robust to missing data.
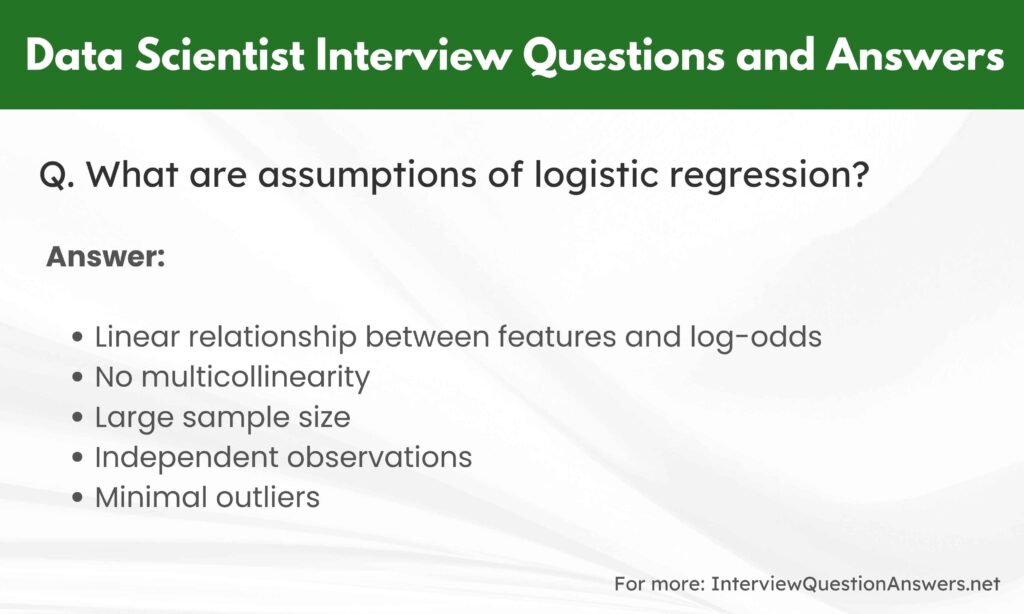
29. What are assumptions of logistic regression?
Answer:
- Linear relationship between features and log-odds
- No multicollinearity
- Large sample size
- Independent observations
- Minimal outliers
30. How do you interpret p-values in regression?
Answer:
P-values indicate whether the coefficients of independent variables are statistically significant.
- p < 0.05: significant predictor
- p > 0.05: likely not a useful predictor
31. Explain Type I and Type II errors with an example.
Answer:
- Type I Error: False positive (e.g., a non-fraud transaction marked as fraud)
- Type II Error: False negative (e.g., a fraud transaction not detected)
32. How does the EM algorithm work?
Answer:
EM (Expectation-Maximization) is used for models with missing/hidden data.
Steps:
- E-step: Estimate hidden variables
- M-step: Maximize likelihood using estimates
- Repeat until convergence
33. How are eigenvalues and eigenvectors used in PCA?
Answer:
In PCA:
- Eigenvectors determine directions of new feature axes
- Eigenvalues indicate variance explained by those directions
Top components with highest eigenvalues are selected for dimensionality reduction
34. Explain PCA in simple steps.
Answer:
- Standardize the data
- Calculate the covariance matrix
- Compute eigenvalues and eigenvectors
- Choose top k eigenvectors
- Transform the data using the selected components
35. What is KL divergence and how is it used?
Answer:
KL divergence measures how one probability distribution differs from another.
Use Cases:
- Comparing predicted vs actual distribution
- Variational Autoencoders
- NLP and recommendation systems
36. What is the difference between generative and discriminative models?
Answer:
| Model Type | Learns | Example Models |
|---|---|---|
| Generative | Joint probability (X and Y) | Naive Bayes, GANs |
| Discriminative | Conditional probability (Y given X) | Logistic Regression, SVM |
37. How do you tune hyperparameters effectively?
Answer:
Methods:
- Grid Search
- Random Search
- Bayesian Optimization
- Tools:
from sklearn.model_selection import GridSearchCV
GridSearchCV(estimator, param_grid, cv=5)
38. How do you detect and treat outliers in data?
Answer:
Detection Methods:
- Box plot
- Z-score
- IQR
- Isolation Forest
Treatment:
- Remove outliers
- Cap values (winsorization)
- Use robust models (tree-based)
39. What is the difference between batch learning and online learning?
Answer:
| Learning Type | Description | Use Case |
|---|---|---|
| Batch | Train on full dataset at once | Static datasets |
| Online | Incremental learning with new data | Streaming, real-time systems |
40. How would you design a real-time fraud detection system?
Answer:
- Ingest data: Use Kafka, Spark Streaming
- Feature engineering: Extract time-based, location-based features
- Modeling: Use lightweight models (e.g., Logistic Regression, XGBoost)
- Real-time inference: Deploy model using REST API or stream processor
- Alerting: Send alerts for suspicious transactions
- Feedback loop: Use analyst-reviewed data for model retraining
Detailed Interview Guide here: Data Scientist Interview Questions for Experienced

Also Check: Data Analyst Interview Questions and Answers
Data Science Technical Interview Questions Python
41. What is the difference between a list and a tuple in Python?
Answer:
- List: Mutable, can be changed after creation
- Tuple: Immutable, cannot be changed after creation
| Feature | List ([]) | Tuple (()) |
|---|---|---|
| Mutability | Mutable | Immutable |
| Performance | Slower | Faster (less overhead) |
| Use Case | Dynamic collections | Fixed data collections |
42. How do you handle missing values in a DataFrame using pandas?
Answer:
Common methods:
import pandas as pd

df = pd.read_csv("data.csv")

# Remove rows with missing values
df.dropna()

# Fill missing with mean
df.fillna(df.mean())

# Fill with constant
df.fillna(0)
43. What is broadcasting in NumPy?
Answer:
Broadcasting allows NumPy to perform arithmetic operations on arrays of different shapes by “stretching” the smaller array without copying data.
Example:
import numpy as np

a = np.array([1, 2, 3])
b = 5
print(a + b)  # Output: [6 7 8]
Here, b is broadcast to match the shape of a.
44. How is a lambda function different from a regular function in Python?
Answer:
- Lambda: Anonymous, single-expression function
- Def function: Named, can include multiple statements
Example:
# Lambda
square = lambda x: x**2

# Regular
def square_fn(x):
    return x**2
45. What are Python generators and why are they useful?
Answer:
Generators are functions that use yield to return values one at a time, allowing iteration over large datasets without loading everything into memory.
Example:
def countdown(n):
    while n > 0:
        yield n
        n -= 1

for i in countdown(3):
    print(i)  # Output: 3 2 1
46. How do you perform group-wise operations using pandas?
Answer:
Use groupby() in combination with aggregation functions:
df.groupby("department")["salary"].mean()
df.groupby(["dept", "role"]).agg({"salary": "sum", "bonus": "mean"})
47. How do you merge or join datasets in pandas?
Answer:
Use merge() for SQL-style joins:
pd.merge(df1, df2, on="id", how="inner")
pd.merge(df1, df2, left_on="emp_id", right_on="id", how="left")
Types of joins: inner, left, right, outer
48. What are decorators in Python and how are they used?
Answer:
A decorator is a function that modifies the behavior of another function without changing its code.
Example:
def log(func):
    def wrapper():
        print("Logging...")
        func()
    return wrapper

@log
def greet():
    print("Hello!")

greet()
# Output:
# Logging...
# Hello!
49. How do you use list comprehensions and dictionary comprehensions?
Answer:
- List comprehension:
squares = [x**2 for x in range(5)]- Dictionary comprehension:
d = {x: x**2 for x in range(3)} # {0: 0, 1: 1, 2: 4}They’re concise and more efficient than traditional loops.
50. How do you handle large datasets efficiently in Python?
Answer:
- Use generators instead of loading all data
- Read data in chunks using pandas.read_csv(…, chunksize=10000)
- Use Dask or Vaex for out-of-core processing
- Optimize data types:
df["col"] = df["col"].astype("category")51. What is the difference between @staticmethod and @classmethod in Python?
Answer:
| Decorator | Accesses Class? | Accesses Instance? | First Parameter |
|---|---|---|---|
| @staticmethod | No | No | None |
| @staticmethod | Yes | No | cls |
Example:
class MyClass:
    @staticmethod
    def greet():
        print("Hello!")

    @classmethod
    def info(cls):
        print(f"This is class {cls.__name__}")
Want more questions? check this: Python Interview Questions and Answers
Data Scientist Interview Questions PDF
We are also adding questions and answers PDF file link so you can download it and prepare offline later.
FAQs: Data Scientist Interview
What is the role of a Data Scientist?
A Data Scientist is responsible for extracting insights from data using various data analysis techniques. They utilize tools and programming languages such as Python to manipulate and analyze large amounts of complex data, ensuring data integrity and quality throughout the data analysis process.
What challenges do data scientists face during interviews?
Data scientists often encounter challenging interview questions that assess their knowledge and experience with data analysis tools, data visualization, data cleaning, and handling missing data. They may also be tested on their ability to communicate insights from data effectively.
What is the salary range for Data Scientists in the USA?
In the USA, Data Scientist salaries vary widely based on experience, location, and the company. On average, entry-level positions may start around $85,000, while experienced Data Scientists can earn upwards of $130,000 or more, especially at top tech companies.
Which companies are known for hiring Data Scientists?
Top companies that frequently hire Data Scientists include tech giants like Google, Facebook, Amazon, and Microsoft, as well as financial institutions and healthcare organizations that rely on data analytics to drive business decisions.
How can candidates prepare for a Data Scientist interview?
To prepare for a Data Scientist interview, candidates should familiarize themselves with common data Scientist interview questions and answers, practice data analysis projects, and gain proficiency in data manipulation and data visualization tools like Tableau. It’s also important to understand the types of data and data structures they may encounter.
What are the key skills required for a Data Scientist?
Key skills for a Data Scientist include proficiency in programming languages such as Python, experience with data cleaning and data wrangling, knowledge of data analytics software, and the ability to perform exploratory data analysis. Strong analytical and problem-solving skills are also essential.
What is the importance of data quality in a Data Scientist’s role?
Data quality is crucial as it affects the accuracy and reliability of insights derived from data analysis. Data Scientists must ensure the data being analyzed is clean, well-structured, and free from errors to make informed decisions and provide valuable recommendations.
Conclusion
We’ve already shared important Data Scientist interview questions and answers. These include topics for freshers and experienced candidates, with a mix of technical and practical examples.
The questions cover Python and teachnical problem solving too. You can also download the PDF to study offline anytime.
We hope this helps you prepare better and feel more confident in your next data science interview. Good luck!


